

Quantitative Methodology
Quantitative research, once you reach the methodology chapter, can feel like speaking a foreign language–even if you’ve studied it before, being away and not practicing can leave you less than fluent. It offers its own specific challenges when compared to qualitative methodologies, from operationalizing variables, selecting instruments for data collection, and planning for your statistical analysis.
In contrast to qualitative research, quantitative studies have predefined variables that determine the presence of relationships between and among those variables. In other words, they’re deductive, investigating “if” something already thought of is true. There are a couple of main strengths to a quantitative approach that we emphasize to our statistical consulting clients.
There are 3 ways to initiate contact with us:
- Please review and submit the following form. Someone from our team will contact you within 1 hour (during business hours), or at your requested time.
- Our consulting team is available via telephone Monday through Saturday from 8:00 A.M. to 8:00 P.M Eastern Time. Feel free to call us on (702) 708-1411!
- We also pride ourselves on our very prompt and in-depth e-mail responses, 365 days per year. We normally answer all urgent queries very promptly, including late-night and weekend requests. You can email us at Info@PrecisionConsultingCompany.com
Please be prepared to discuss the specifics of your project, your timeline for assistance, and any other relevant information regarding your proposed consultation. We respect the confidentiality of your project and will, at your request, supply you with a Non-Disclosure Agreement before discussing specifics.
First and most obvious, you can determine the statistical relationships between variables–something that is not possible in qualitative research, with its focus on perceptions and experiences of phenomena, rather than the phenomena itself. Second, numerical data are comparatively easy to analyze (as opposed to qualitative data), you are not limited in your sample size. This allows you to use large samples of randomly selected participants, which in turn allows you to confidently generalize the results from your statistical analysis to the broader population this sample represents.
At Precision, we provide targeted statistical consulting to help you develop and address the following areas of your quantitative methodology section (as they apply to your study):
- Definitions of your variables
- Creation of research questions and testable hypotheses
- Discussion of survey instrument or archival dataset
- A statistical analysis plan which lays out the precise methods and tests that will be performed for the study
- Validity and reliability of your constructs
- Power analysis to determine the optimal/required sample size
More specifically, we offer comprehensive dissertation assistance with each key area of your methodology section or chapter, to ensure you have a clear plan for data collection and statistical analysis to present to your chair, committee, and IRB.
- We first conduct a one-on-one consultation and an in-depth review of your prospectus, concept paper, or proposal draft, to understand the general aims of your study. In particular, we’ll familiarize ourselves with your variables and selected research design, and your plans for data collection, including any preliminary discussion of your survey or other instruments and your testing plan.
- At this point, we then develop a comprehensive plan for focused statistical consulting assistance, emphasizing any key areas that should be revisited or supported by current research in your discipline. These initial recommendations include everything from revisiting your research design (many researchers new to statistical analysis select a descriptive design, but this is typically not robust enough for doctoral-level research), to performing your power analysis, to updating your testing plan to ensure that your statistical analysis will definitively prove or disprove your hypotheses.
- After a little back and forth on the planned methodology, we then work with you to assist in the creation of a draft of your methods section. In addition to the specific issues mentioned above, we can also help you address the validity and reliability of your constructs and data collection instrument, as well as any additional tests you might need to conduct to account for issues such as a smaller-than-ideal dataset or to validate a new data collection tool.
While finalizing a complete draft of the methodology for more complex quantitative research can be time-consuming, we’re able to draw on our more than 10 years as a leading statistical analysis firm to complete this work as little as 2-3 days. We know that your time is valuable and can work with virtually any timeline!
Let’s keep it a secret…
Before sharing your materials with us, we will send you our Non-Disclosure Agreement, which guarantees that your work materials, and even your identity as a client, will never be shared with a third party.In this video, we’ll talk a lot more about what might be a terrifying subject for you — statistics! Rather than overwhelm you, though, with complex terms and confusing symbols, I’ll be looking to just help you make some decisions about your dissertation and how best to conduct your study.
I should say that we won’t be able to avoid those terms altogether, but there won’t be any confusing symbols. The terms, when used, will be aimed to help you make those good decisions I mentioned.
First, though, just a little bit of background information for the sake of context. Dissertation projects can be qualitative, quantitative, or mixed methods in approach.
Two of those options involve statistical analysis, and only purely qualitative studies get to avoid the difficulty of this work. Before you feel envious, know that qualitative analysis might be even more difficult! We help you unpack it in a few other tutorial videos.
if you’ve stumbled here by accident, know that we’re one of the only consulting firms that can take on the really difficult coding we describe in those qualitative analysis instructional videos!
And now back to stats! It can be like a foreign language — even if you’ve taken courses in it, being away and not practicing can leave you less than fluent. Just like the vocabulary items, verb conjugations, and syntactical concerns associated with a language, statistics offers a number of challenges, too.
First is operationalizing variables. This means that you have to figure out just what a variable means, in concrete terms. If you’re looking at the effectiveness of a curriculum for students, what does “effective” mean? Does it mean that it increases student performance? Okay, that’s great. Does it increase performance more than a different curriculum addressing the same skills would, or is it just any increase? In addition, students are tested a lot — what will you use to determine that increase in performance? This step can be tricky and getting help at this stage of your dissertation is natural.
In short, there’s just a lot to consider, and the last item I mentioned pointed in the direction of another issue, and that’s selecting instruments. Once you operationalize a variable, you have to figure out how to measure it — how to turn it into numbers.
This is straightforward when it comes to performance, as that’s often quantified naturally. However, what about self-efficacy or acculturation? Fortunately, instruments exist that take care of this measurement for your dissertation, and we can help with finding these for you! We definitely suggest that you select an instrument that already exists and has been pre-validated. It’s possible to design your own, but it comes with strings attached: You have to conduct a pilot study to first determine certain types of validity and reliability for your investigation. (More on that later!)
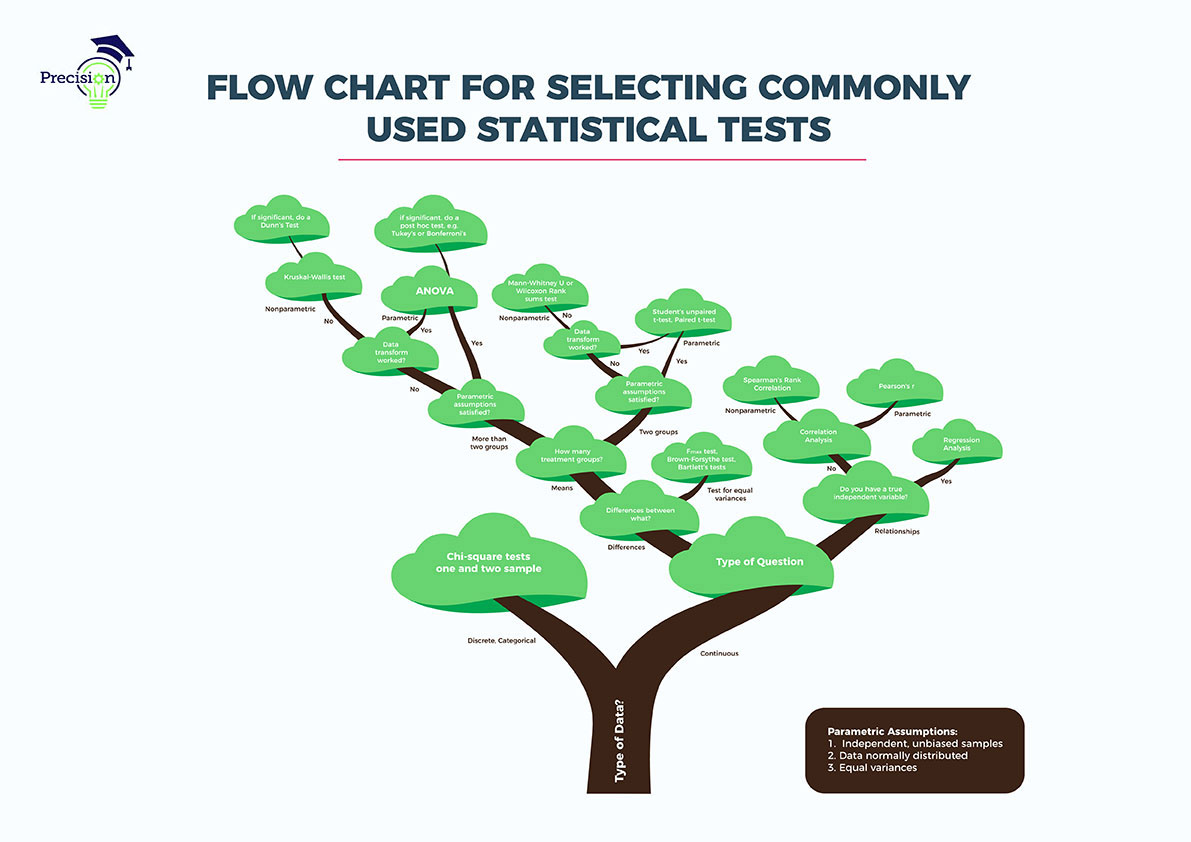
The final step is planning your statistical analysis — how do you know what to do? There are so many tests to run, and while you remember some of the names of them, accessing in your memory just which ones work in which situations is much more difficult.
In this video, we’ll take a closer look at two of these concerns.
In our earlier module on qualitative methods, we talked about the strengths and weaknesses of a qualitative research approach and of a quantitative approach. Let’s review those here briefly and then put them in the context of a study you might be conducting.
You’ll be able to see the differences right away — in many ways, they’re opposites! Let’s start with qualitative research:
Okay, so here you’ll see that qualitative studies can be really powerful — partly because the research isn’t limited by more than scope in the responses that can be drawn from it. It moves inductively, and so no hypotheses guide it. As a result, it’s flexible and open-ended, and it uses language, rather than numbers, as the data to be analyzed.
For all of these reasons, a central strength of qualitative studies is that they can be great for exploratory research, where very little is known and where initial work is needed to better understand a phenomenon.
Those strengths carry weaknesses with them, though! Because language is involved, and often through interviews (at least in part), sample sizes are really small compared to quantitative studies. Analysis of a huge amount of data here is just very difficult, and gathering it might be even more time-intensive!
Because sample sizes are small, generalizing from a sample of participants to an overall population isn’t possible — it cannot be assumed that the sample is a representative one. For this reason, and because qualitative research proceeds without established variables, it’s also not possible to determine clear relationships among any variables or constructs. Participants might perceive a relationship, but that’s not the same!
Again, quantitative studies can be opposite in many ways!
Let’s start with relationships: Quantitative studies can determine them! Specifically, statistical analysis often moves deductively, knowing in advance what the variables are. They set out to measure those variables in particular, and they do so in numerical fashion, usually with pre-validated survey instruments (again, more on this soon!).
As a result, data collection and analysis are much less time- and resource-intensive, and so large samples are possible here. That’s great! As long as sampling is done sufficiently and in the right ways, then generalizing to the broader population can also be done.
This makes the results of quantitative studies particularly strong, though with those strengths come some weaknesses, too. Notice that I’ve been saying “relationships” to talk about what quantitative studies can determine — in most cases, causation is not one such relationship! Without an experimental design or complex time series methods, it’s not possible to determine causation; instead, quantitative studies most often determine only correlation. In our statistical consulting, we often find that candidates struggle with language use in the dissertation, particularly with research questions and hypotheses. We’ll talk more about this when we get to specific designs!
Finally, because quantitative studies have such large samples, they focus on people as members of groups, rather than as individuals — outliers, then, or those people who respond differently, aren’t examined more closely. That is, we don’t get to know generally why they responded differently.
You might be thinking, “This is great!” And it is! But what should you do? In our video on qualitative research methods, we looked at a research gap — related to nurses and turnover — that lent itself better to a qualitative methodology.
Let’s say that you’ve actually moved on to a new topic — and to a new program altogether! — and you’re now studying education. Specifically, you’re really interested if peer-mentoring programs for new college students help them be more successful in school and more likely to remain and get their degrees.
A comprehensive review of the literature reveals that peer-mentoring programs can different from one another quite a lot — with some focusing purely on navigating courses, and others helping them to fit more fully into the “culture” of college and the particular university campus.
A qualitative approach would be wonderful for your research in some ways, particularly in helping you understand how students experience an intervention, if they feel that it’s effective, and how they perceive that they can navigate the new environment of school because of the intervention. Unfortunately, though, you wouldn’t be able to generalize from your small group of students to the broader group of freshmen. And, you’d not know if the program was effective, even for them — you’d know only if they feel that it is or will be.
Of course, “effective” could mean many things, but let’s remember that your concern earlier was about whether it would help them stay in school. A further dig into the literature can be helpful, and let’s say that you find that non-academic variables, such as self-efficacy, can be particularly powerful predictors of student retention.
With a quantitative study, you would set out to measure those specific variables: participation in a peer mentoring program and self-efficacy. With solid measurements of each, you’d be able to use statistical analysis to determine the relationship between them. Insofar as self-efficacy is bound up with retention, you can also develop some sense of how “effective” the peer-mentoring program is.
Because you’ll be working with a larger sample size for this study, using a pre-validated instrument to measure self-efficacy easily, you’ll also be able to generalize from your sample to the larger population of freshman students at the school.
That sounds great! Between these two options, then, it sounds like a quantitative methodology would give you a clearer picture of what you’re after.
It might seem as though the decision made itself here! Remember that a qualitative study would have worked well here, too, and it would just have answered a different set of questions and in a different way. What’s wonderful here is that your interest plays a key role — in our dissertation consulting work, particularly at the early stages, we prioritize learning more about our clients’ interests for research. You’ll be living with your study for a while, so it’s important to love it!
If you’re still not sure what would be best, give us a call! We can work with you to unpack your research gap and explore your options, giving you a clear idea whether your focus points toward a qualitative, quantitative, or even mixed methods approach! Mixed methods studies, I should say, can be particularly exciting. They have some drawbacks, but they combine the benefits of qualitative and quantitative research approaches. See our video on mixed methods for a better sense of the possibilities!
Please note, too, that regardless of what you decide, we can help either way. While you might have a preference for one methodology, your committee members might, too! This is especially the case with the major online universities, and we can work with your precise dissertation to provide the help that will allow you to navigate the competing aims here effectively!
Let’s say that your committee is on board with a quantitative approach, too, and so you’re ready to move ahead. What’s next? In your foundational work and then in your methods chapter, you’ll need to discuss research design right after you talk about methodology.
But! Let’s stop and talk about just a couple of things that will be needed for your study.
All along, we’ve been talking about a large sample size (relative to qualitative studies) as a benefit of quantitative work! However, many candidates do struggle to have access to a sufficient number of participants and so determine that a qualitative study will be needed. Many candidates reach out for dissertation help only when they’ve run into this sample size obstacle, so we often provide assistance with this very issue.
If you’re at the start of the process, please let us know! We actually start our topic development process for our clients with an in-depth methodologist call for this very reason: Operating even at early stages with a sense of what will work for methodology will be really important!
One common question is, “How large a sample do I need?” That brings us to a power analysis.
There are two kinds of power analysis, actually. The first, and most common, is called an a priori power analysis. Just like it’s name would suggest, it’s done outside the experience of the study. It tells you how many participants you need to reach a threshold for statistical significance. This calculation is usually done in G*Power. This calculation depends on a series of inputs, including for statistical power and confidence interval, and the output of the calculation is a minimum sample size to achieve statistical significance for your particular study and the testing you’ll be taking on. It’s a tricky step, so we often provide consulting with this critical step in developing statistical methodology.
The other kind of power analysis is an a posteriori or, more commonly, post hoc power analysis. It uses as inputs the actual size of your sample (and your statistical testing), to determine the statistical power associated with your actual sample size. In our consulting, we’re asked about this less commonly, but your dissertation committee can ask for it if you achieve a sample size that is lower than the minimum sample size called for by the a priori power analysis.
The next concern for you here is actually related to the first: instrumentation.
We’ll need to back up just a little bit here and talk about variables. They can be categorical (also called nominal), ordinal, or continuous (also called interval). To make it clear right away, let’s apply these to the variables for our example study. The independent variable will be “participation in a peer-mentoring program.” Notice that it’s not how long the program is, how long sessions are, or anything like that — it’s just participation. As such, our possible values here are “yes” and “no.” In most kinds of quantitative studies, then, students would be placed into one of these two categories. As such, it’s a categorical variable.
Self-efficacy is just a little bit trickier. We’ll get into instrumentation in a moment, but let’s say that self-efficacy is tested by a number of 7-point Likert scale items in a survey. Most often, these data would be treated as continuous — continuous or interval variables are measured numbers in along a continuum. Likert scale data are actually ordinal in nature, and there are a few strange quirks like this for a dissertation. Talking to a consultant about them can help to shed light on them! Age is more traditional continuous variable, as would be grade point average and a number of other variables — most (but not all!) surveys measure variables as continuous ones.
Because the nature of your variables helps to determine what statistical tests you’ll do — and because what statistical tests you’ll do determines your input for a power analysis — it’s important to work backwards here.
That means engaging with statistics maybe a bit sooner than you planned!
There’s another common concern related to instrumentation — there has to be one! In particular, there should be pre-validated instrument to measure any variable you’re looking to measure. “Pre-validated” means that the instrument has already been determined to be a valid one (it measures what it means to — in this case, self-efficacy). In addition, it measures it each time it’s used (in other words, it does that measurement reliably).
While it’s possible to validate an instrument that you create, your committee will recommend that you use a pre-validated instrument with established psychometric data. We do too!
In situations where you’re determined to create something new, or if you’re modifying an existing instrument in any significant way, you’ll need to take on what’s called a pilot study.
Requirements for a pilot study differ depending on your program, or even your committee, and the nature of your study. For sampling, at least, things are pretty consistent! A smaller sample than the one that will be used in your main study appears here. You’ll need to recruit approximately 20 participants, though sometimes the rule is a 10% rule. That is, the sample size for a pilot study should be about 10% the size of the main study’s sample. I should note that the sample for your pilot study cannot be part of your sample for your main study!
Testing is where it gets interesting and potentially quite complex — and a lot of work! Indeed, whole dissertations can be devoted to the development of a new instrument, and many clients working on quantitative dissertations reach out for help at this stage. In these instances, the testing tends to be more robust. In other situations, a candidate is able to proceed with just reliability testing. This is done specifically through Cronbach’s alpha, and it tests what’s called internal consistency reliability, or the degree to which the instrument agrees with itself.
In many other cases, the pilot test would also include construct validity testing. This kind of validity testing is most often done through a two-step factor analysis process and using exploratory factor analysis (EFA) and confirmatory factor analysis (CFA).
This part is quite fun, actually! In our statistics consulting, we love to take on this validation: EFA results in questions “loading” onto a series of as yet undefined factors. From here, the researcher is able to derive a definition for each factor — this would be a construct (such as customer satisfaction) that you’d like to measure!
Then the work of the CFA that follows is to test the hypotheses about those constructs that are devised during the EFA work — it “confirms” that the exploratory factor analysis has been done correctly!
I know this sounds complex! It definitely is, and so if you find yourself in the position of needing to take on validation work for a pilot study, please give us a call or send an email. We can provide precisely the consulting that you need to move forward successfully with your statistical methodology. This is help we provide each day, actually, and we’re happy to do it!
Once this has been resolved for you, you can start to think and make decisions about research design. Again, this will be discussed right after methodology in your foundational work and methods chapter.
For quantitative designs, there are five main options: descriptive, correlational, causal-comparative, quasi-experimental, and experimental.
Descriptive:
A descriptive study does as it says — it describes! Specifically, it doesn’t have an independent variable, but rather a group of participants that form the unit of study.Let’s apply this to our investigation. We’re looking at self-efficacy as a function of participation in a peer-mentoring program for first semester undergraduate students. So, a descriptive study would analyze levels of self-efficacy in a “unit of analysis,” or a group of students who’ve participated in that peer-mentoring program.
In terms of analysis, it would proceed with descriptive statistics — for continuous data like self-efficacy scores, this typically includes minimum, maximum, mean, median, and standard deviation.
Often, this design isn’t sophisticated enough for a doctoral dissertation. We can help you to add refinement by adopting one of the other designs I’ll talk about.
Correlational:
Next is correlational. A correlational study takes on just a little bit more complexity in the form of one or more independent variables. Just like a descriptive study, it will have one or more dependent variables, but to measure correlation, you’ll have to examine that dependent variable with reference to another variable — again, the independent variable.I’ll stress here that correlational design studies measure correlation! They don’t determine causation. Let’s see it in terms of a study we might conduct. Let’s say we want to determine the relationship between participation in a peer-mentoring program (independent variable) and change in self-efficacy (dependent variable).
It would be possible to administer a self-efficacy survey to a sample of students before they began the program and then provide the same assessment after completion of the program. In this case, we could compare students’ self-efficacy scores at the pre-program stage with scores at the post-program stage to determine if a relationship exists between experience of the peer-mentoring intervention and self-efficacy.
Again, though, causation would not be determined here, in part because of confounding variables. It could be that other factors — class participation, meeting new people, simply time at school — could play a role here, as well! Controls on these variables for your dissertation help to increase its sophistication.
Causal-comparative:
A causal-comparative study is next. It’s one that — you guessed it! — involves comparison. Here, there are independent and dependent variables still (that will be the case going forward, as well), and in many ways, the causal-comparative design resembles the quasi-experimental and experimental designs that we’ll discuss in a moment. What’s different about a causal-comparative study, though, is that it examines differences that already exist between or among groups of people.In other words, the groups cannot be manipulated by the researcher. Gender is a good example of this — a researcher can’t select genders for participants! For our sample study, a causal-comparative version of it might be one where increases in self-efficacy from the peer-mentoring program are examined as a function of gender — that is, to see if male and female students respond differently to the peer-mentoring program.
You’ll notice that this study has now gotten more complex! Candidates can sometimes struggle when getting to the design portions of their dissertations and reach out for help from a statistician. We’re here to provide it!
Quasi-experimental:
As I hinted at above, experimental and quasi-experimental studies feature one or more independent variables that can be manipulated. What’s great about this is that we can begin to arrive at causal links between or among variables this way! I should mention that quasi-experimental studies, though, are not fully experimental because they lack random assignment. Meaning, the researcher can’t decide randomly to place some participants into the experimental group and others into the control group.What situations might this happen in? Let’s apply it to our sample study: Let’s say that you not all students participate in the peer-mentoring program — as a result, we have two “treatment” groups to compare, in the form of an experimental group and a control group. Again, though, the researcher can’t pick who participates and who doesn’t, as it’s an optional program.
Experimental:
In a true experimental design, random assignment is able to happen. Examples of this abound, and in Science Fair, students begin practicing it right away. An example might be randomly assigning young plants to a “rock music” group, a “classical music” group, or a control group and then administering the treatment. We have variables here, and the difference between this design and a quasi-experimental one is that random assignment. It makes for a stronger study because it helps to control for confounding variables (perhaps levels of sunlight, days elapsed before seed germination, and others).What’s tricky about our sample study, about the peer-mentoring program, is that true experimental design can sometimes not be allowed. We see this particularly in education, there are concerns about research ethics, particularly when it comes to withholding from students something that is potentially beneficial. Let’s put ethics aside, though, and say that, hypothetically, random assignment were possible here. Through that random assignment in your dissertation, you can help to control for potentially confounding variables (and there are many!), including high school GPA, IQ, first-generation college status, race, ethnicity, socioeconomic status, and many others.
Okay! I think we’ve done it. I know that, while I’ve explored with you just now the main options for selecting a research design, it’s not always this straightforward! And like I’ve mentioned a few times so far, you can choose any quantitative design in an ideal world — but it’s not an ideal world!
Ethical boundaries and simple practicality will close off options for you — there might not be an easily-established control group, for instance, or you might not be able to gain approval or access for all of the data you might want to gather.
Understanding exactly what you’re after then, as well as what’s possible, and how to classify that, is something we can assist with if it’s a struggle, or even if you’d just like confirmation from a statistician that you’re doing it right, we can definitely help!
That assistance starts back at the topic development stage, where we can work with you on some of these questions, providing strategic help to get you off the ground and moving forward all the way through to dissertation editing. Regardless of the stage at which we start with you, we work to final approval at no additional charge for this reason, and please reach out — we’d be happy to hear from you!
Thanks!