

Survey Development
Surveys are powerful tools to develop a better understanding of your customers, target audience, employees, and stakeholders. With a rigorously designed and implemented survey, firms, government agencies, and non-profits can harness invaluable information to help inform their strategic, financial, and operational decision making. However, if design and implementation aren’t optimal, survey research can lead to ill-informed decision making based on unreliable and invalid information, and with serious consequences for operations, performance, and competitive advantage.
Precision’s team can assist you with rigorous survey development and data analysis at any step of the process. Our survey development team will provide you with a customized approach based on your research goals, sampling frame, intended output, and, of course, timeline. We’ll develop a solution specific to your organization, your survey research needs, and your sector to provide statistical consulting and analysis support for the entire survey research process.
Whether you need assistance with specifying the initial survey, developing the sampling plan, conducting psychometric tests for reliability, validity, and power, or analyzing the collected data—or each of these steps—we’ll develop a plan to meet your specific needs.
There are 3 ways to initiate contact with us:
- Please review and submit the following form. Someone from our team will contact you within 1 hour (during business hours), or at your requested time.
- Alternatively, our consulting team is available via telephone Monday through Friday from 8:00 A.M. to 8:00 P.M Eastern Time (5:00 A.M. to 5:00 P.M Pacific Time), and from 8:00 A.M. to 7:00 P.M. Eastern Time on Saturday (5:00 A.M. to 4:00 P.M Pacific Time). Feel free to call us on (702) 708-1411!
- We also pride ourselves on our very prompt and in-depth e-mail responses, 365 days per year. We normally answer all urgent queries very promptly, including late-night and weekend requests. You can email us at Info@PrecisionConsultingCompany.com
Please be prepared to discuss the specifics of your project, your timeline for assistance, and any other relevant information regarding your proposed consultation. We respect the confidentiality of your project and will, at your request, supply you with a Non-Disclosure Agreement before discussing specifics.
At Precision, we have vast experience with survey design and development, as well as survey research implementation and data analysis. Our survey development and data analysis team includes former professors and program evaluators who have performed survey research on behalf of the US National Science Foundation, the US Department of Energy, and subnational agencies and non-profits in the US and abroad, alongside senior market researchers and strategists with long experience and expertise performing survey research in the US and internationally for major corporations and small and medium-sized enterprises.
If you’re developing and implementing a survey instrument to inform your organization’s operational, financial, or strategic decision making, it’s critical to plan for each step of the process. Precision’s survey development team can help you anticipate and avoid common mistakes that could render your survey datasets and data analysis invalid or even damaging, such as mono-source bias, unreliable measurement, invalid measurement, social response bias, multi-collinearity, and simultaneity bias.
We’re able to provide this comprehensive support because our survey development and implementation team includes both PhD-level social scientists and quantitative methodologists who understand intimately the potential challenges that accompany any survey-based research project. This combined expertise allows us to better circumvent potential issues while considering your goals for research design, the development of the survey instrument, and of course, your firm’s specific knowledge creation needs.
Our survey development process begins with an initial consultation to understand the overarching goals for your instrument and the constructs you plan to measure. When designing a survey, researchers must identify not only how to ask questions, but what questions to ask. Our analysts will refine your information goals and determine the most precise way to measure that information. We work with you to operationalize your variables and constructs for future analysis, and to make choices such as whether or not to include open-ended or free-response questions, and when to use a Likert scale or Slider scale, along with other pre-coded response options.
Once your survey instrument is generated, we can discuss your sampling methodology and help you to select the most feasible and robust option for your research. Depending on your goals, timeline, access, and budget, participants can be selected randomly or stratified into relevant subgroups. We can help you implement purposive sampling to target specific individuals, convenience sampling to maximize ease of access, or probability sampling that reaches a random group of respondents.
Online Platform Assistance: Over the past decade, more and more of our clients, particularly in the corporate sector, are choosing to implement survey research using online platforms. We are very familiar with the leading online survey tools, including SurveyMonkey, Qualtrics, Google Forms, and Zoomerang. If you plan to use any of these tools, we can help you input the survey into the tool for you so that you’re able to make optimal use of its data collection capabilities, as well as download and collate the data outputs once survey collection is complete. If you’re unsure of which survey tool to use, we can discuss your specific needs and goals, suggest which platform would best suit your study, and then manage the data collection process.
Pilot Testing: For clients designing an entirely new tool or making significant modifications to an existing instrument, we can help you design and then analyze data from a pilot study to test for preliminary reliability and validity. When your methodology and sampling plan are fully determined, our statisticians can perform a thorough pilot test to ensure that your survey is effective when it reaches your clients. To determine the significance of your pilot results, our analysts can check for various types of validity (such as discriminant, convergent, and concurrent validity) and reliability (such as split-half, Cronbach’s alpha, or test-retest reliability). We can also run confirmatory factor analyses with LISREL or AMOS, and can test for statistical power to establish the required sample size for your survey before you begin data collection.
Expertise in Statistical and Qualitative Analysis: After data collection is complete, our statistical consulting team can then conduct a full statistical analysis based on your chosen methodology. We are familiar with all of the standard quantitative methods most commonly used in evaluating survey research–and because of our unique positioning as experts in qualitative research and analysis, we can also explore the themes of any open-ended research questions, using the qualitative analysis packages NVivo, ATLAS.ti, MAXQDA, and Dedoose, among others.
Let’s keep it a secret…
Before sharing your materials with us, we will send you our Non-Disclosure Agreement, which guarantees that your work materials, and even your identity as a client, will never be shared with a third party.Our business and academic clients alike often find themselves in need of a rigorous survey to measure constructs that they’re interested in. In consulting with our academic clients regarding statistics, it’s often possible (and always ideal!) to use a pre-validated survey instrument — something that already exists and has been tested for validity and reliability.
That’s because the work of validation can be difficult. When we work as consultants with our doctoral clients, though, we often find that no pre-validated instrument exists, and we’re always happy to devise the survey, design the pilot testing needed to ensure validity and reliability, and then take on that statistical testing to make sure that the instrument is ready to go.
For our business clients, operationalized constructs are often unique — while concerns such as customer need and satisfaction apply to most or all businesses, as an example, the way each looks for a particular company is quite different. Thus, for this type of applications, ensuring that the survey used is valid and reliable is critical to guarantee that the findings of any statistical analysis are meaningful and provide actionable recommendations.
We’ve worked with clients on a great many projects just like this.
Some real examples from our actual clients include (a) customer perceptions about product quality, (b) employees’ job satisfaction level, (c) management styles and effectiveness.
As I was saying, developing a reliable, statistically valid survey is critical to drawing accurate and powerful conclusions from analysis of data. Collecting data for analysis is a very costly and time-consuming endeavor. This is true for our academic research clients, and more so for our business clients. Because it’s so resource-intensive, for small and large businesses alike, it’s vital to spend the necessary time with a statistician designing an appropriate survey instrument and making sure it will work properly, before the data collection process begins.
In this video, we’ll talk a lot more about what makes an effective survey instrument, what principles underlie their construction, and hopefully demystify what can often be a really overwhelming process.
First, the most important factors in the effectiveness of a survey are those characteristics I mentioned before: validity and reliability.
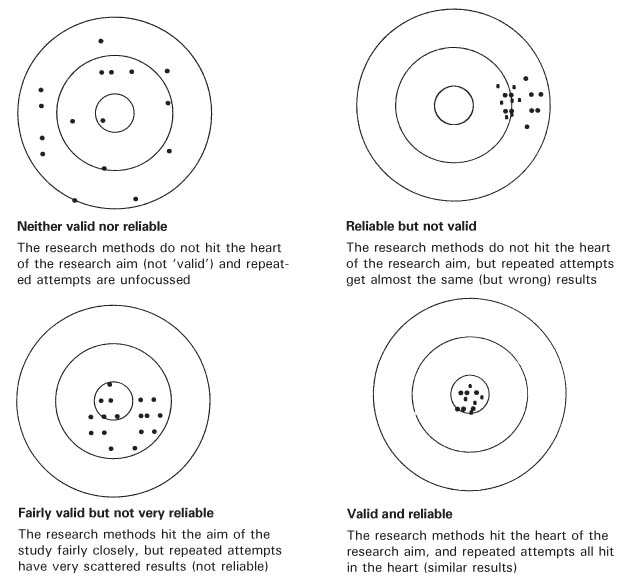
When data analytics companies talk about validity and reliability, they’re talking about two separate but connected constructs. Validity is about accuracy: measuring what you want to. Let’s imagine that we want to measure customer satisfaction. The center of this target here… let’s say this one here…represents that construct.
Now, picture each of the marks I’ve drawn on the target on the target as a survey and response from a participant; in this case, a customer of yours.
Since surveys are really resource intensive, it’s important to ensure that the survey measures satisfaction and not one or more constructs that might be related to satisfaction but not exactly the same. It’s natural at this stage to seek assistance from a statistical consultant to make sure you navigate this step successfully. In my example, you can see that the marks are generally not hitting the bull’s eye. This is a case in which the survey is not valid.
On the other hand, you can see that all marks are generally clustered around the same point. This brings us to the issue of reliability, or precision. This survey is reliable, though, because it’s generally always producing the same or similar result. Unfortunately, it’s reliably wrong, it gives precise information about a construct we’re not interested in.
Now consider another case.
On average, these marks are clustered around the bull’s eye, meaning that this survey appears to be indeed measuring customer satisfaction. It is indeed a valid survey. However, even though the survey produces the desired result on average, it is not reliable, because it lacks precision. The marks are too far apart from each other.
You should now be able to deduce the remaining two cases!
This is an example of a non-valid, non-reliable survey. The marks are clustering around a different spot, not the bull’s eye, making the survey not valid. They are also far apart from each other, meaning it lacks precision as in the previous case. It is thus not reliable.
Finally, this is a case of a valid, reliable survey. All responses are close to each other, making this survey precise. They are also hitting the bull’s eye, meaning that we are indeed measuring customer satisfaction. The main goal of survey design is to ensure that your survey works as in this last example.
We consult with clients with precisely this work every day, both as they look ahead to survey development and as they actually work to make their instruments successful for their statistical research needs. Please know that we’re here to help with any issues you’re encountering, and you can call us anytime.
All of this implies that you’re focusing on quantitative survey questions, but I’d be missing something I didn’t correct that. Surveys break down into two main types: qualitative and quantitative. We’ll focus most of our time on quantitative here, because these instruments produce the hard data that can help to drive your business decisions.
Let’s get specific! Here’s a clear statistical example that reflects a need that we consult with businesses about often, which is market research.
In market research, firms are looking ultimately for what helps increase sales. It’s hopelessly complicated, and it’s driven by myriad factors, from geography and clientele to overall market conditions and competitor-level variables. When companies seek out data analytics assistance, it’s often to try and understand this complexity. We’ll zero in here on one key factor in all market research: customer satisfaction.
Again, this can be addressed qualitatively or quantitatively, and I’ll describe here what qualitative surveys on satisfaction can address. Generally, qualitative surveys are applied through unstructured or semi-structured interviews or conversations with the participants. In this way, the interviewer might ask questions such as “what do you value most when deciding to buy this product?”, “why do you value quality over price?”, “what do you think would make the product better?”
Through qualitative analysis, these types of questions can help to really zero in on the subjective responses that a customer has to the brand or to specific products or services.
For this reason, the resulting data can be really rich, revealing the complexity behind the respondents’ thoughts and the decisions that they make.
However, this is best yielded through interviews, and those are incredibly difficult to get, and they result in huge cost.
Finally, because they’re so expensive, they usually result in really small sample sizes. This can make the wide understanding that companies often need hard to obtain.
A quantitative instrument is on the other side of the spectrum, and in ways that tend to make it ideal.
First, it can’t get at participants’ uniquely subjective experiences the same way that qualitative data collection, especially interviews, can. Instead, surveys are really targeted in examining really specific factors that are specified a priori, when planning the survey.
There is a lot less flexibility in the way that questions are asked, for instance, since they are close-ended, typically scored in a 5- or 7-point Likert scale. They move deductively, aiming at testing whether an established hypothesis is true or false. So, while a qualitative survey might ask “what do you value most in the product”, a quantitative one would ask “rate from 1 to 5 how important is product quality to you?” This drawback is also a strength, though, because surveys provide targeted answers to questions as a result.
As I said before, all research is intensive and demands a lot of resources. However, quantitative surveys are generally much less expensive than are interviews. Given modern technology, surveys can be hosted online and shared with a very large number of potential respondents instantly. As a result, companies interested in consumer analytics can be much more efficient with resources in gathering quantitative data.
The last benefit here goes along with that. With a defined budget, a company can get many more responses from a survey, and from a much larger sample, than they can from interviews and other qualitative approaches. When doing market research and other kinds of study, a business would like to get as much actionable information from any many people as possible. Making it easy to respond and in really targeted ways helps to achieve that.
As I said before, quantitative surveys typically use Likert scale type questions and responses. Having consistently coded questions is important for clients to get a better understanding of what the survey questions are aiming at. Assuming the questions are well-designed with the help of statistical consultant, this can help improve the survey validity and reliability, as it increases the likelihood that all your respondents will understand and interpret the survey questions in the same way.
While we can help with both qualitative and quantitative research, the focus here in this video is on validation for a developed survey instrument. If you’d like to learn more about the qualitative analysis — often called coding — that results from qualitative data collection, check out our video on that in the academic consulting section of the website!
Back to our quantitative instrument: Once you have finished writing the survey questions and their possible multiple-choice responses, it’s time to test its validity and reliability.
In order to test for survey validity and reliability, a pilot test is often used. A pilot test is nothing more than an administration of the survey you designed to a relatively small sample. Since you need to make sure that your survey is valid and reliable before you deploy it for your research and analysis, you’ll need to use a smaller group of people not included in that research. The statistical data from the pilot test is to be used exclusively for survey design and evaluation purposes, and not for the main goal of the survey, such as measuring customer satisfaction.
Occasionally, additional survey questions can be incorporated in the pilot test, to test whether some version of a survey question is better than another one, and to decide which one to keep. In some more complex and longer surveys, the same question might even be asked more than once, to check whether the respondent provides the same answer in both cases. In our consulting with firms on these questions, we often recommend this.
Outside of statistical testing, sometimes pilot tests include questions that directly ask respondents what they thought about the survey clarity, whether they thought it was too long or too short, and anything that might help improve the final version of the survey. The important thing to keep in mind about pilot tests is that they are all about designing the best survey possible. Once this process has been completed, the real data collection can begin.
In other words, the point of the pilot is to test the validity and reliability of the survey before it goes to the whole sample. There’s nothing worse than creating a survey, skipping the pilot test, and then finding out the results are unreliable or invalid. As a result, while it might be inconvenient, we always recommend working with a statistician to design a pilot study (even a small one) for all or clients requiring survey development.
Let’s now discuss the actual tests used to assess validity and reliability. With a full set of pilot test data in hand, attention can turn to running the statistical tests and procedures that allow us to analyze the extent to which the survey is valid and reliable.
Let’s start with reliability. Now, in academia, many types of reliability have been defined. These include inter-rater or inter-observer reliability, test-retest reliability, parallel-forms reliability, and internal consistency reliability.
Although all of these are important, typically the most attention is given to the last one, internal consistency reliability. We will discuss it in some detail.
Internal consistency reliability measures how consistent are the results across an entire instrument, or across pre-defined sections of that instrument. It is usually the case that instruments have more than one section, with the full instrument measuring one variable and portions of it measuring its several “domains” or “sub-scales.” For example, a job satisfaction survey might comprise 40 survey questions. Question 1 through 8 could be designed to measure “work/life balance”, questions 9 through 16 could aim at measuring “satisfaction with interaction with co-workers”, items 17 through 24 could measure praise and recognition, and so forth.
In this example, these sub-scales would be said to show internal consistency reliability if all items within each scale tends to move along in the same direction as the others.
Internal consistency reliability is usually measured with a metric called Cronbach’s alpha. The formula for this metric is rather simple.
As you can see from this formula, this coefficient tends to go up when p, the correlation among the items, increases. This represents what I was explaining previously: we want items in the same domain to be highly correlated with each other, suggesting that they are measuring the same construct. In other words, Cronbach’s alpha determines how effectively the instrument agrees with itself.
In our data analytics work, we often encounter companies that struggle with interpretation. Luckily, in the case of Cronbach’s, the mathematical definition of this formula is conveniently designed so that the coefficient varies from 0 to 1, with higher values indicating higher reliability. Remember, however, to reverse score any survey questions in which that is applicable. Otherwise, the correlation coefficients, and thus Cronbach’s alpha, will be incorrectly calculated. For example, consider 3 items measuring job satisfaction. All of them are rated from 1, meaning strongly disagree, to 5, meaning strongly agree.
Items 1 and 2 are such that agreeing with them implies a higher degree of job satisfaction, but agreeing with item 3 would be related with a lower satisfaction. These items would be negatively correlated even if the scale is reliable. Therefore, responses from item 3 would need to be reverse-scored before using the Cronbach’s alpha formula. As such, a score of 1 would become 5, a score of 2 would become 4, and so on. After reverse-scoring as appropriate, the Cronbach’s alpha formula can be used normally. Again, working with a consultant to refine the statistics here can be really beneficial.
Here, we can see what makes for a reliable instrument:
“Acceptable” is a difficult place to get to. And ideally, the instrument achieves “good” or “excellent” internal consistency reliability. Remember you’ll be putting a lot of stock into your results, so ensuring that they’re clustered around that bull’s eye matters. Typically, standard psychometric surveys used in academia and clinical settings, such as those measuring quality-of-life, or mental health, have Cronbach’s alpha higher than 0.8 in all their domains.
Let’s now talk about validity. Like reliability, it comes in many forms. Also just reliability, we’re generally concerned with only some of them! Within this area, we have internal and external validity, convergent and divergent validity, construct validity, concurrent validity, face validity, and many others.
Actually, one type of validity that we’ll be concerned with is not generally tested at the statistical level. This is called face validity, and it needs to be done by hand, generally with two or more consultants who have done surveys in the particular subject previously. An assessment from these experts can determine whether, on its face (that’s where it gets its name!), the survey makes sense and measures what it sets out to. While there is no formal statistical analysis to determine face validity, it is an extremely important first step in survey design, and requires a great deal of domain expertise to ensure that the survey is headed in the correct direction.
The other main kind of validity that pilot studies attempt to determine is construct validity — that the questions come together to measure what they’re intended to. Assessing this type of validity involves relatively complex statistical analysis procedures.
These procedures are generally defined under the umbrella of Exploratory Factor Analysis (EFA), Confirmatory Factor Analysis (CFA), and Structural Equation Modeling (SEM).
These statistical methods are somewhat difficult to apply, but we can help! While we would need several hours of consulting to discuss underlying mathematics of these procedures, I can give you an overview of what are their goals.
EFA is typically used as a preliminary statistical analysis, for cases in which you don’t know how items within a survey can be grouped into sub-domains; or whether they should be put in sub-groups at all. Remember our previous example with a Job Satisfaction survey, with items 1 through 8 measuring work/life balance, items 9 through 16 measuring satisfaction with coworkers, and so on. When we are in the initial stages of survey design, it might not yet be clear which items measure what.
Imagine a simple example with 6 items.
Before collecting pilot data, we can’t know which ones are related with what. Are items 1, 2 and 5 highly related? And then items 3, 4 and 6 are highly related among themselves, but maybe they’re not with the other three items? Are maybe items 1 through 5 highly related, with 6 moving independently from the others? Are all 6 items highly related?
EFA can give us answers to these questions. Through complex mathematical formulas, EFA examines the correlations among all items and determines an optimal separation of them, producing relatively few groups of items that are tightly coupled…
These groups are called factors, and they form the basis of what might be the sub-domains in the final version of the survey. In this example, the EFA results tell us that items 1 through 3 measure one domain, while items 4 through 6 measure a different domain.
EFA also produces, for each item, a value called a factor loading, which shows how strong the statistical relationship between an item and its factor is. These factor loadings can be especially useful to know in cases in which they are low, typically lower than 40%. This would mean that the item is not strongly related to any factor. Generally, this is an indication that the item could be removed, or was poorly worded and was unclear to respondents. In our consulting with businesses, we often work to navigate this complex process.
Confirmatory Factor Analysis is a sort of second step after the exploratory one. In EFA, we allow the data to tell us what is the structure of the factors. In contrast, in CFA, as its name implies, we attempt to confirm through statistical analysis a factor structure that we hypothesize a priori.
Suppose we have a customer satisfaction survey, with 6 items as in the previous example. We expect items 1 through 3 to measure satisfaction with quality. We also expect items 4 through 6 to measure satisfaction with delivery speed. Finally, we also expect both types of satisfaction to be somewhat related with each other, since they are both expressions of general customer satisfaction. We could thus test this factor structure through CFA.
Each of these arrows represents the relationship between the underlying factor we are interested in, such as satisfaction with product quality, with the survey items that we expect to to be related with it. Analysis results from the CFA will tell us whether these relationships, which are also called factor loadings, are statistically significant. A factor loading that is not statistically significant suggests that the item we hypothesized to be related to the factor is not really related to it. This is a warning sign, suggesting that the item could be removed, or that it needs to be reworded, like we saw when we discussed EFA.
CFA provides us several other pieces of interesting information, One of them is represented by this arrow. This is the relationship between both sub-domains. In this example, it would tell us what is the implied relationship between satisfaction with quality and delivery speed. This is important information that could eventually be used to merge sub-domains. For instance, if the relationship is very strong, then both hypothesized constructs might be measuring one and the same factor after all, and the survey could be simplified by dropping one (or more) sub-domains, making it shorter, easier to complete, and thus improving the response rate. Again, working through these complex statistics with a consultant can help to ensure the success of your instrument.
Finally, CFA provides overall measure of goodness of fit, which give us a general idea of how well the data matches our hypothesized factor structure. There are several such metrics, with the most commonly used ones being: Comparative Fit Index, Tucker-Lewis Index, Root Mean Square Error of Approximation. These coefficients generally vary between 0 and 1, with higher values indicating that the hypothesized structure is correct. In contrast, poor value in these metrics indicate that there are problems with the survey. There is a wide variety of possible issues that could be detected at this point. For instance, some items might load on a different factor than expected. Or, some pairs of items could be so highly correlated that one of them is redundant and could be removed.
In any case, more advanced techniques need to be used to identify the problem and determine possible solutions. Survey design problems are extremely common, and they are the whole reason why pilot testing is needed before deploying a new survey.
I know this all sounds like a lot of work, and it is indeed a lot of work to do even before we can start collecting data to analyze the phenomenon we’re interested in, such as customer satisfaction. However, detecting survey problems in the early stages is extremely important to avoid disappointing results after investing large amounts of time and money into data collection.
Please know that we’re here to help — survey development is a core area of expertise for us, and that includes both the initial item development and the pilot testing that follows and ensures that you have a valid and reliable instrument!
Call us anytime, and we’ll be here to be your statistics consultant, craft a plan to meet your particular needs, and help you achieve your business goals!